Digital Platform for Real-Time Forest Restoration Monitoring and Geospatial Analysis
Project Overview
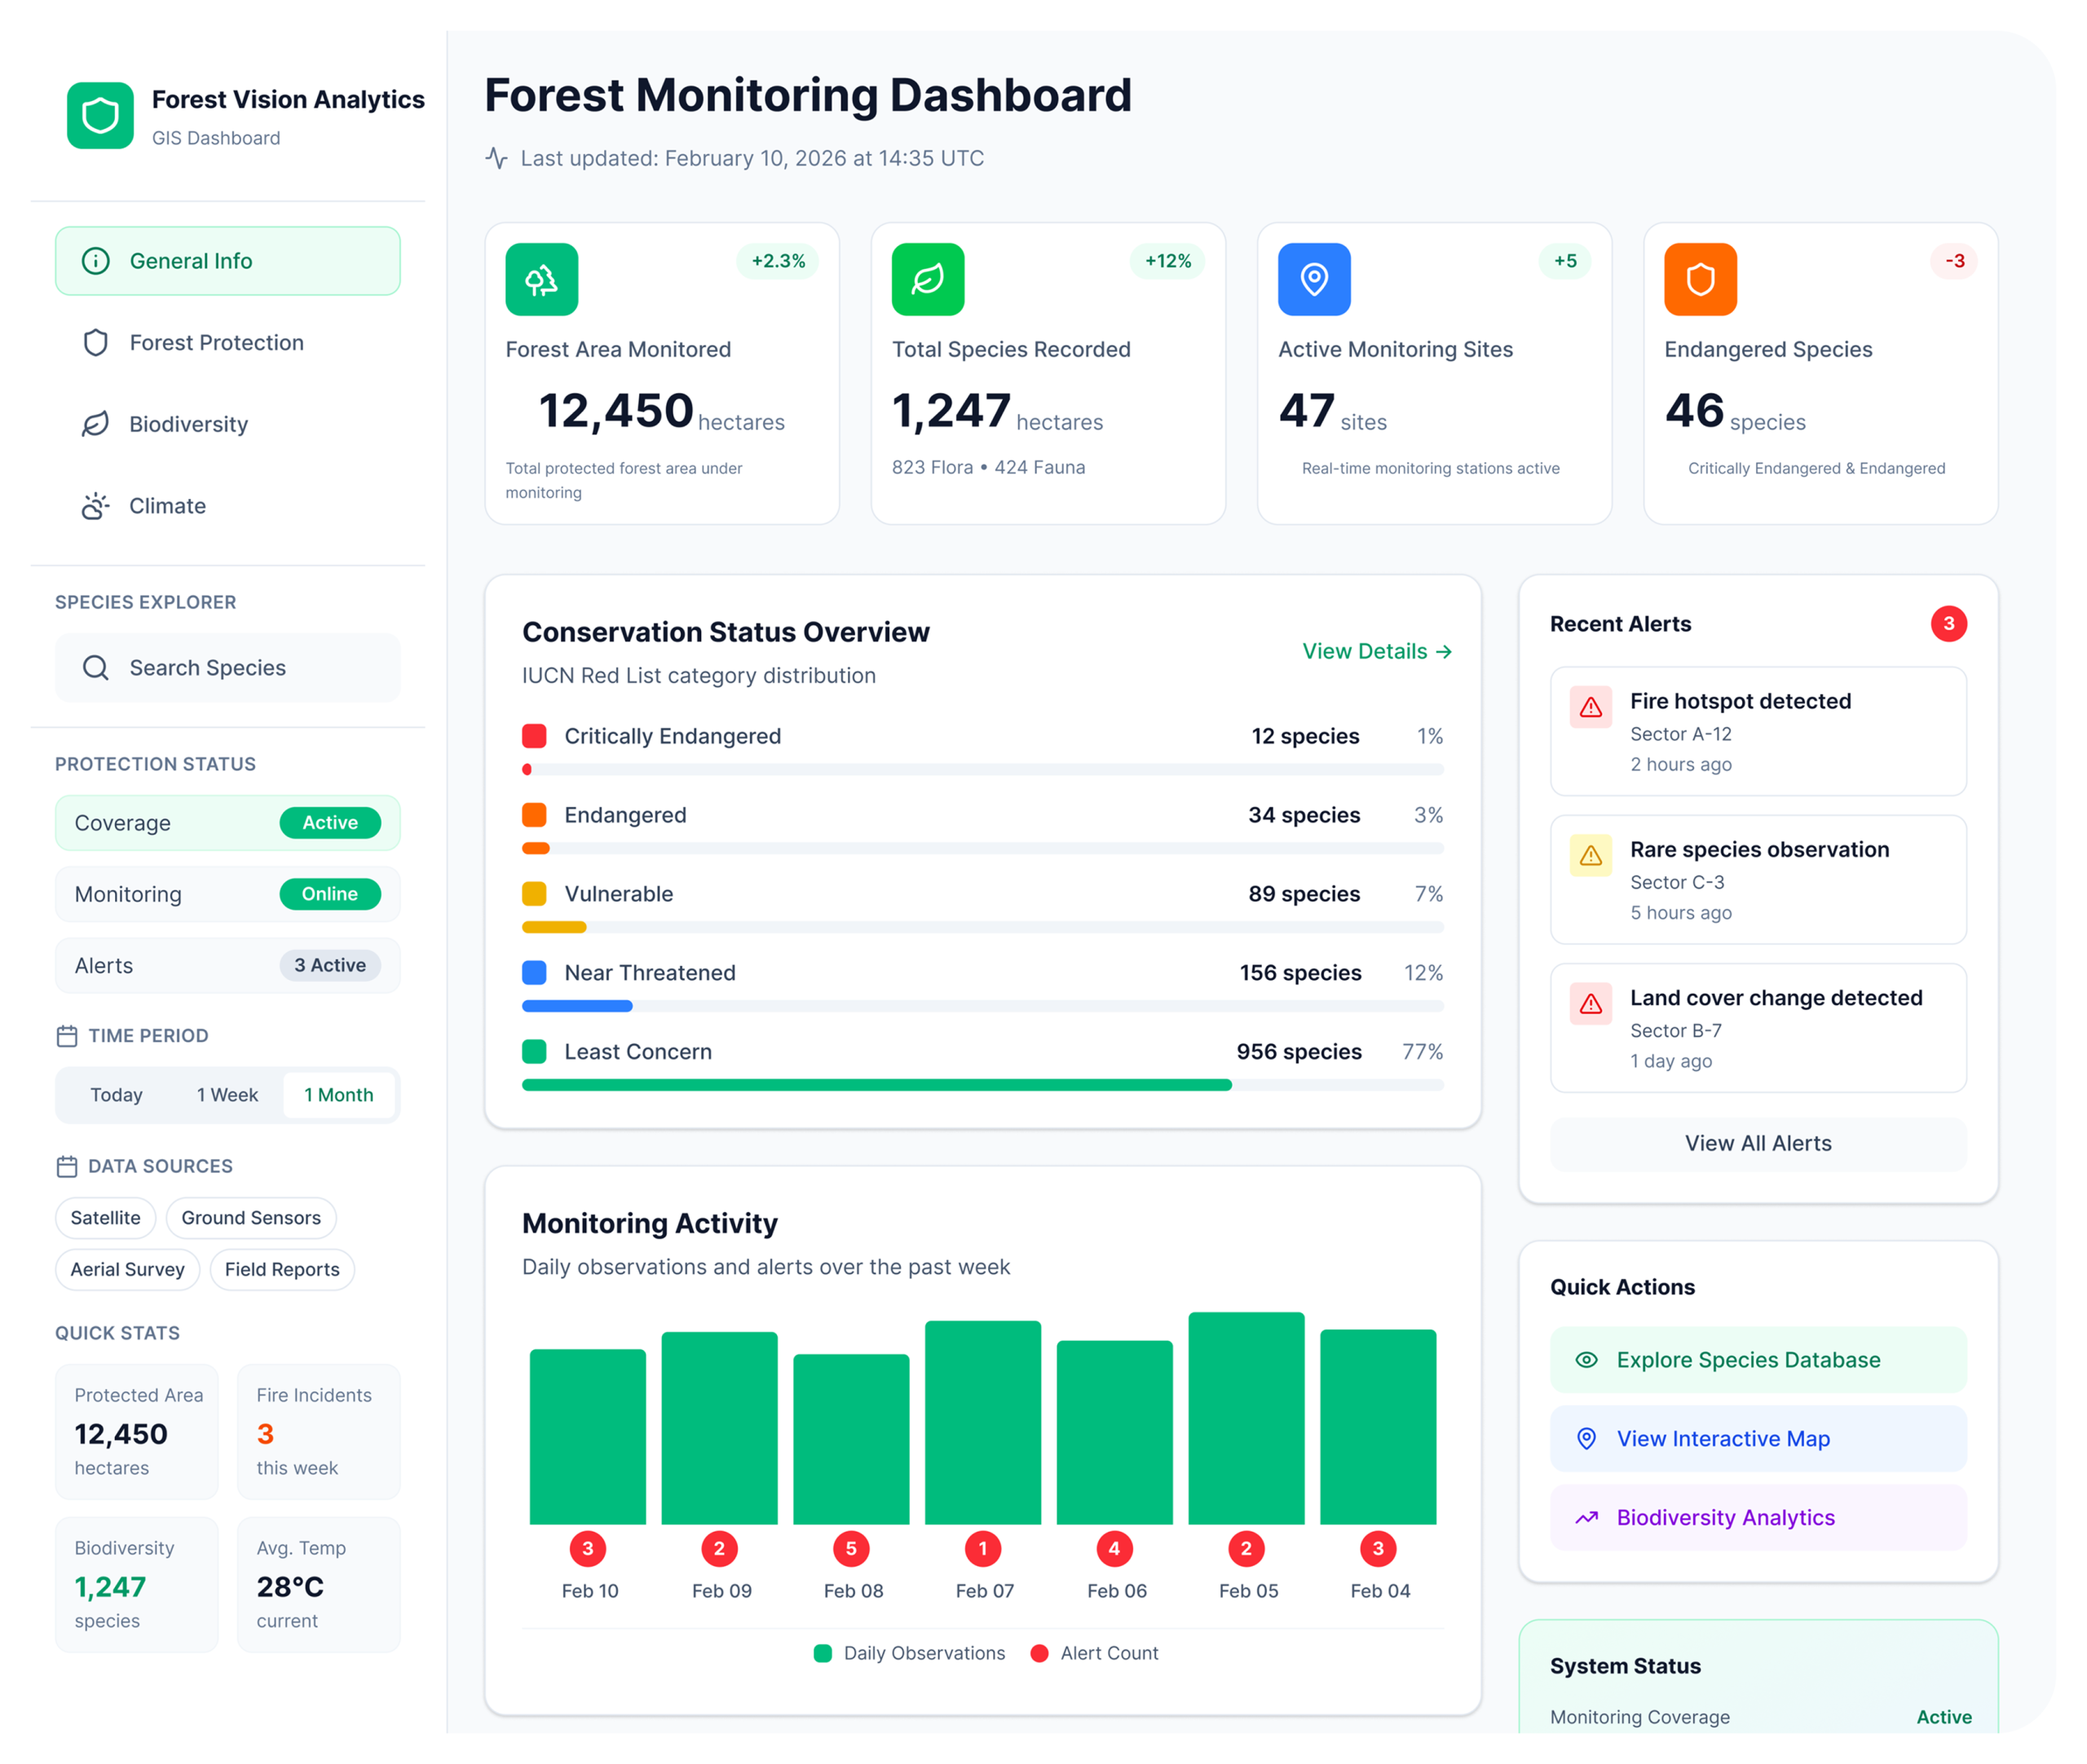
This dashboard was developed as a web-based platform to support real-time operational monitoring of forest restoration areas. The system transforms diverse environmental datasets into interactive, map-based analytical visualizations, enabling field teams and management to comprehensively monitor forest conditions within a centralized platform.
Information is structured into three primary themes forest protection, biodiversity, and climate allowing users to gain a holistic understanding of forest landscape conditions.
Challenges & Pain Points
Previously, environmental data such as climate metrics, fire hotspots, biodiversity records, and land cover information were sourced from separate systems, making integrated analysis difficult. The team also faced challenges in conducting flexible, are-specific analysis and interpreting technical datasets without appropriate visual representation.
Additionally, the need for real-time weather information to support forest fire mitigation posed a critical operational challenged.
Solution Approach
To address these challenges, the dashboard was designed using a thematic structure combined with spatial-based interactive mapping. Users can select predefined Areas of Interest (AOIs) or define custom areas to analyze historical land cover changes and environmental activity.
Multiple environmental data layers are visualized through an interactive map, including rainfall, temperature, wind speed, and fire hotspots. The system also incorporates biodiversity mapping for key wildlife species and integrates real-time weather APIs to support rapid response to potential fires risks.
As a result, forest area monitoring has become faster, more accurate, and measurable. Patrol teams can respond more promptly to potential fire threats, management gains clear visual insight into forest conditions, and landscape change analysis that previously required significant time can now be completed within minutes.
The integration of spatial data within this dashboard enhances operational efficiency while supporting data-driven conservation strategies.
Key Features
Interaction Monitoring
Interactive map visualization for real-time restoration monitoring.
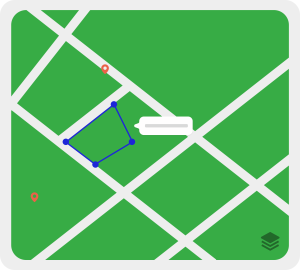 Custom AOI Analysis
Flexible Area of Interest analysis using custom polygon selection.

Climate Data Layering
Integrated weather parameters (rainfall, temperature, wind) within a unified map interface.
Fire Risk Analytics
Hotspot heatmaps and fire risk indicators for early detection.
Land Cover Change History
Historical Visualization of land cover changes for landscape trend analysis.
Biodiversity Mapping
Spatial mapping for monitoring habitats and key wildlife species.
Weather API Integration
Automated synchronization of weather data from OpenWeather and NCCS (NASA Center for Climate Simulation) to ensure real-time field condition accuracy.
1. What This Dashboard Delivers
Real-Time Forest Condition Visibility
Live monitoring of forest restoration conditions within a centralized platform
Flexible Spatial Analysis
Customizable area analysis tailored to field and management requirements
Visual-Driven Decision Support
Complex environmental data presented through intuitive interactive visualizations
Fire Risk Mitigation Support
Real-time weather and hotspot information to support rapid fire response
Comprehensive Mitigation
A holistic ecosystem perspective covering climate, biodiversity, and forest protection aspects.
2. Core System Highlights
Web-Based Geospatial Analytics Platform
A web-based system built on interactive mapping technologies.
Thematic Data Structuring
Data organization based on forest protection, climate, and biodiversity themes.
Multi-Layer Spatial Visualization
Integrated environmental layer within a single unified map.
Custom Area of Interest Engine
User-defined spatial analytics capabilities.
Real-Time External Data Integration
Integration of weather APIs (OpenWeather and NCCS) and other external environmental data sources to validate on-site conditions.
Scalable Spatial Data Infrastructure
A spatial data architecture designed for long-term scalability and expansion.
3. Key Impact Areas
Operational Monitoring Efficiency
Field monitoring processes are significantly faster, more accurate, and measurable.
Faster Fire Risk Response
Improved early detection and mitigation of forest fire risks.
Improved Environmental Analysis Quality
Landscape change analysis that previously required extensive time can now be completed within minutes.
Stronger Data-Driven Conservation Strategy
Conservation planning strengthened through evidence-based spatial data.
Enhanced Cross-Team Awareness
Improved alignment shared understanding of forest conditions between field teams and central management.